

Stop Making Cents
Stop Making Cents
Does the payback period for residential rooftop solar photovoltaic make sense in every state, or only a few cents? Talking heads want to know.

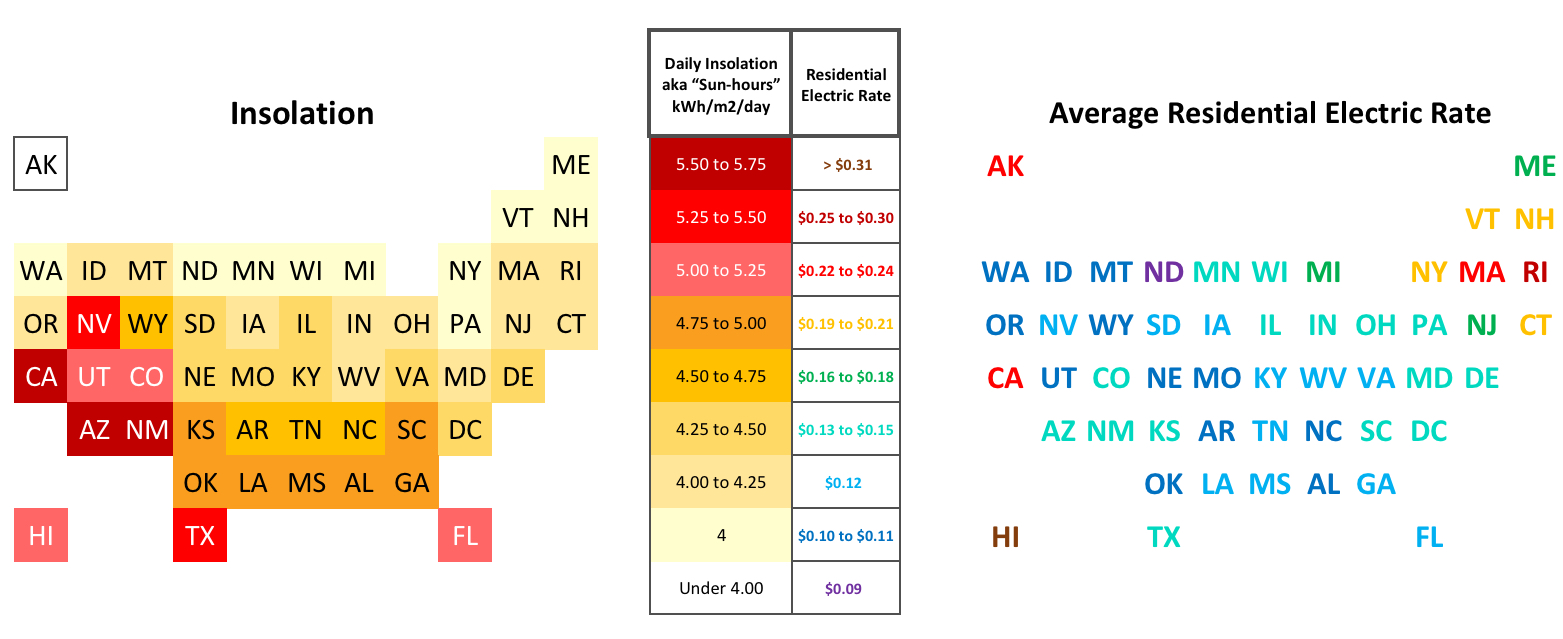
Previously, this paper showed that you do not need to be in the sunny Southwest for rooftop solar to make sense. The Northeast U.S. might have only 70% of the Southwest’s solar Insolation, but with some of their residential electric rates being as high as 143%, the two in conjunction have the same end-result in the average annual electric bill.
Of course this all depends not only on the state, but also the electricity supplier. Residential solar photovoltaic (PV) systems do not provide homes the ability to go Off-Grid, as the home is obviously consuming electricity at night, early-morning, late-evening, and cloudy, rainy and snowy days. The utility company is also not storing electricity for later use. The practice of Net-Metering, not to be confused with Net-Zero, is dependent on the utility purchasing excess generation primarily from summer daytime, in a quantity equal to the household consumption of night and winter.
If the utility does not have an month-to-month carry forward credit policy, which again many states and utilities do not, then even if the rooftop system generates the full annual household consumption, the annual savings will not equal the total annual electric bill. Translation: you bought a system big enough to generate all your electric needs, but you still have to pay the utility for the on-grid convenience of 24/7 power, thereby lowering the PV savings and extending the time it will take for the payback period to reach the breakeven point.
There are myriad other factors applicable to determine breakeven, namely interest rates, the inflation rate of electricity, and most importantly the price of the PV panels themselves. For well over a decade, the price of PV panels has been consistently plummeting. Currently however two straightforward factors are in-play effecting system pricing, temporarily lowered production, and artificially increased demand.
Covid related supply-chain constraints are clearly lowering availability. Drastically increased demand is partly attributable to consumers rushing to take advantage of the 26% Investment Tax Credit (ITC) before the end of the year when it drops to 22% for 2023 and then 10% for 2024, unless Congress extends it, which it shows no signs of doing. Taken together, and furthermore adding an inflation rate not seen in four decades, and for the first time ever, PV prices both for panels and installed systems, are rising.
Therefore for simplicity, this paper does not speculate on future rates and energy prices, of which there are vast opinions. The following data is calculated all at present-values.
What is thankfully simpler, is that the size of the house and the PV system is not important to breakeven. A system twice the size generates twice the energy and therefor has twice the savings. Yet it also costs twice as much, therefore cost divided by savings is the same time period.
A small change in price, a large change in time to breakeven
NREL stated a complete residential PV system (PV panels, inverters, and the Balance Of System [BOS] controllers, breakers, mechanical fastening and electrical consumables, and labor) installed in 2021 was $2.71 per Watt (DC). For example, having 32 PV panels of 330 Watts each is 10,500 Watts, and therefore a system cost of $28,500.
(Note, all wattages used, are the values of the DC current directly from the PV panels. The AC current output from the inverters to the house and utility-grid can be expected to be 55% to 65%. Pricing of of PV system is de facto measured in the DC panel output, not the AC inverter output to the home.)
In a world where the trend of the past 2 decades would have continued, the 2022 PV system installed price could have reasonably been expected to be $2.50/Watt. Instead, after Covid inflation, it rises to $3.00/Watt. But now adding the artificial demand surge to begin installation before January 1st to take advantage of the 26% ITC, plus the Ukrainian war’s effects, and prices are up still further. $3.25 to $3.75/Watt quotations are not uncommon these days, especially closer to major metropolitan cities.
Without Congressional action to extend the ITC, what happens in 2023 when it drops somewhat to 22%, is anyone’s guess. Demand could be, uhm, through-the-roof, before the ITC plummets to 10% for 2024.
Therefore this paper will show the breakeven for a rooftop PV system, at current average state electric rates, with a Capital Expense (CapEx) based on the cost from a low price returning to trend, to a very high price exacerbated by inflation and demand-surge. There are four varying system-cost basis rates used in calculating breakeven, from a low $2.50 to a high $4.00 per Watt (DC):
$2.50/Watt pre-Covid expected price based on consistently dropping PV prices.
$3.00/Watt pricing with post-Covid inflation.
$3.50/Watt with demand surge to take advantage of the expiring ITC.
$4.00/Watt combined demand surge & inflation.
First is an examination of the time it takes to breakeven given the current 2022 ITC of 26% fully applied to the net cost.
Next is is an examination or the increased time required to breakeven in 2024 when the ITC drops to 10%, also fully applied to the net cost.
— At the 2022 ITC of 26% —
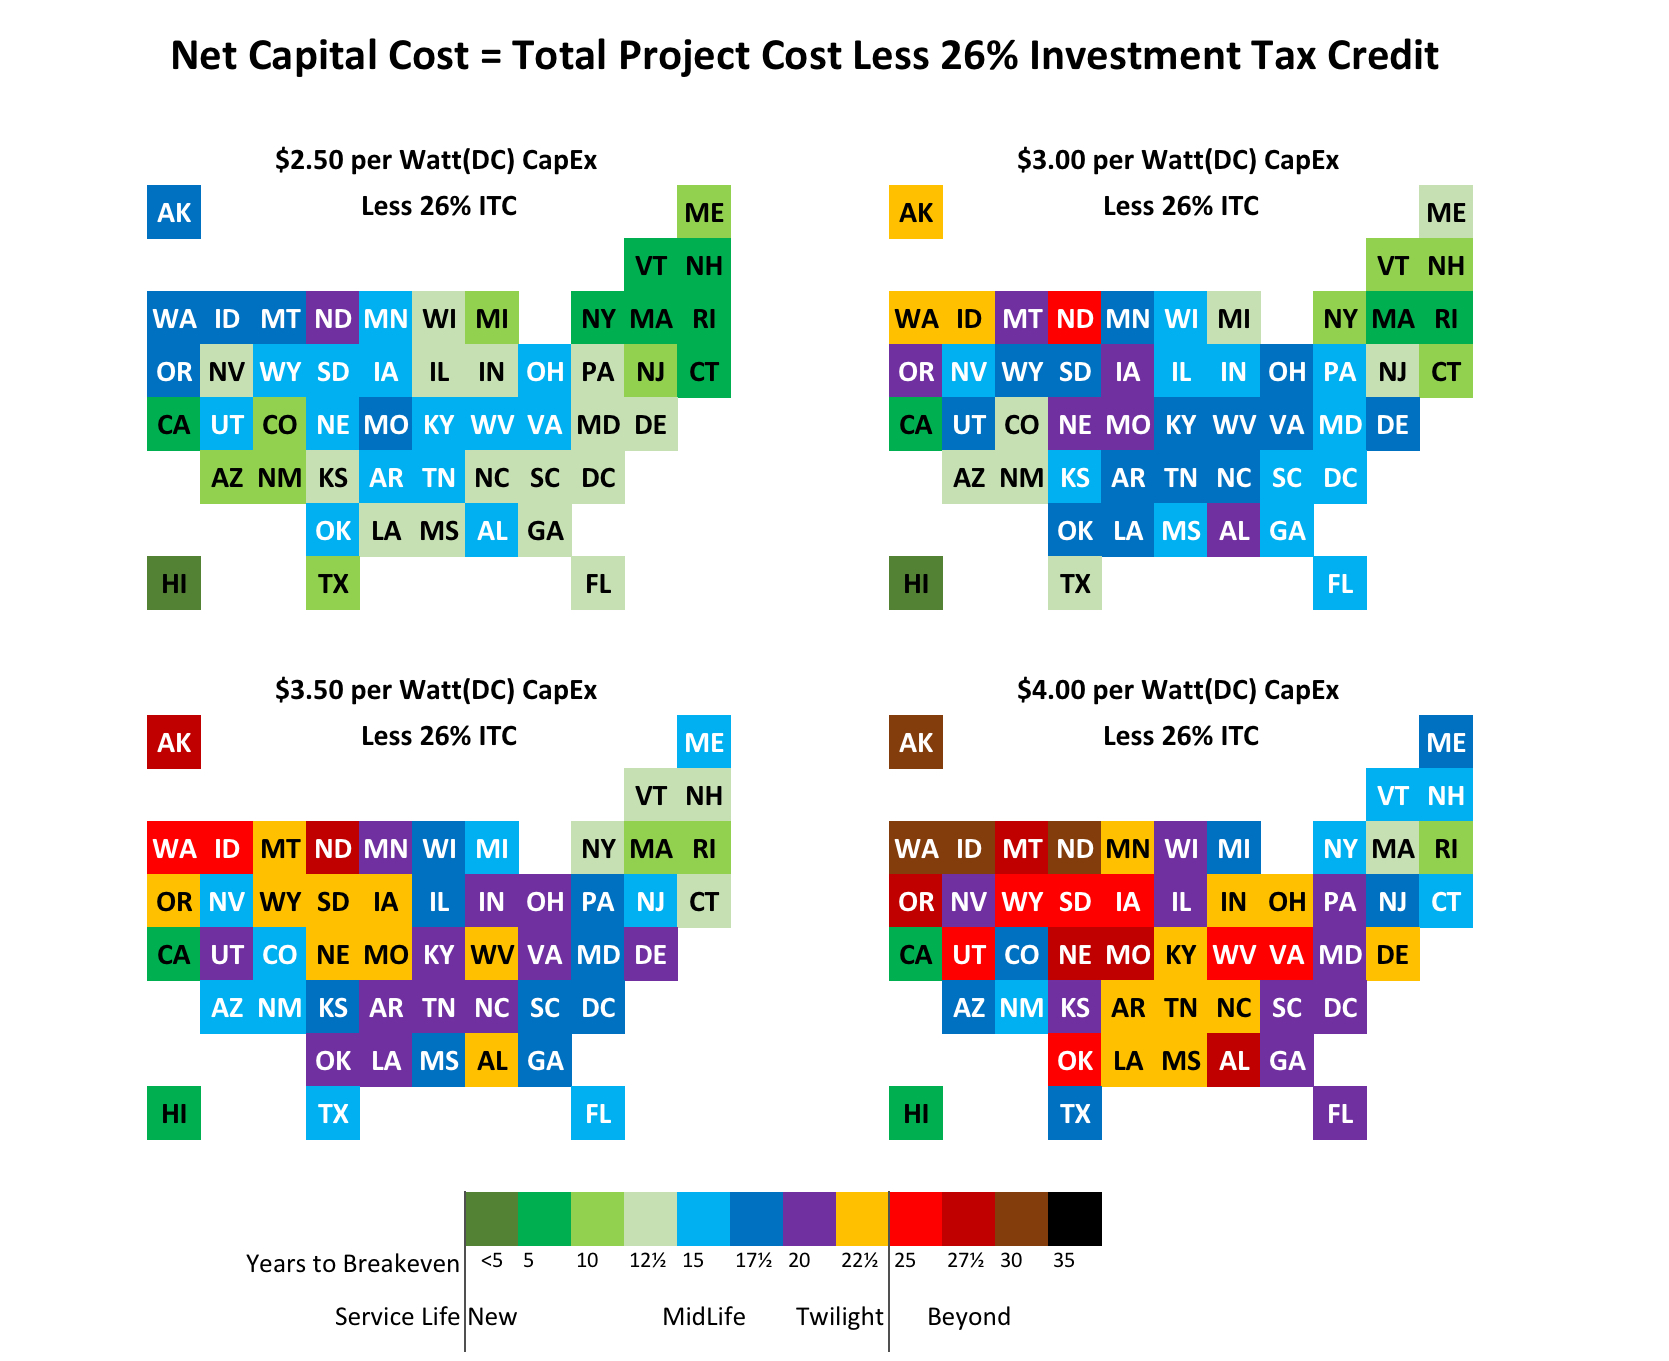
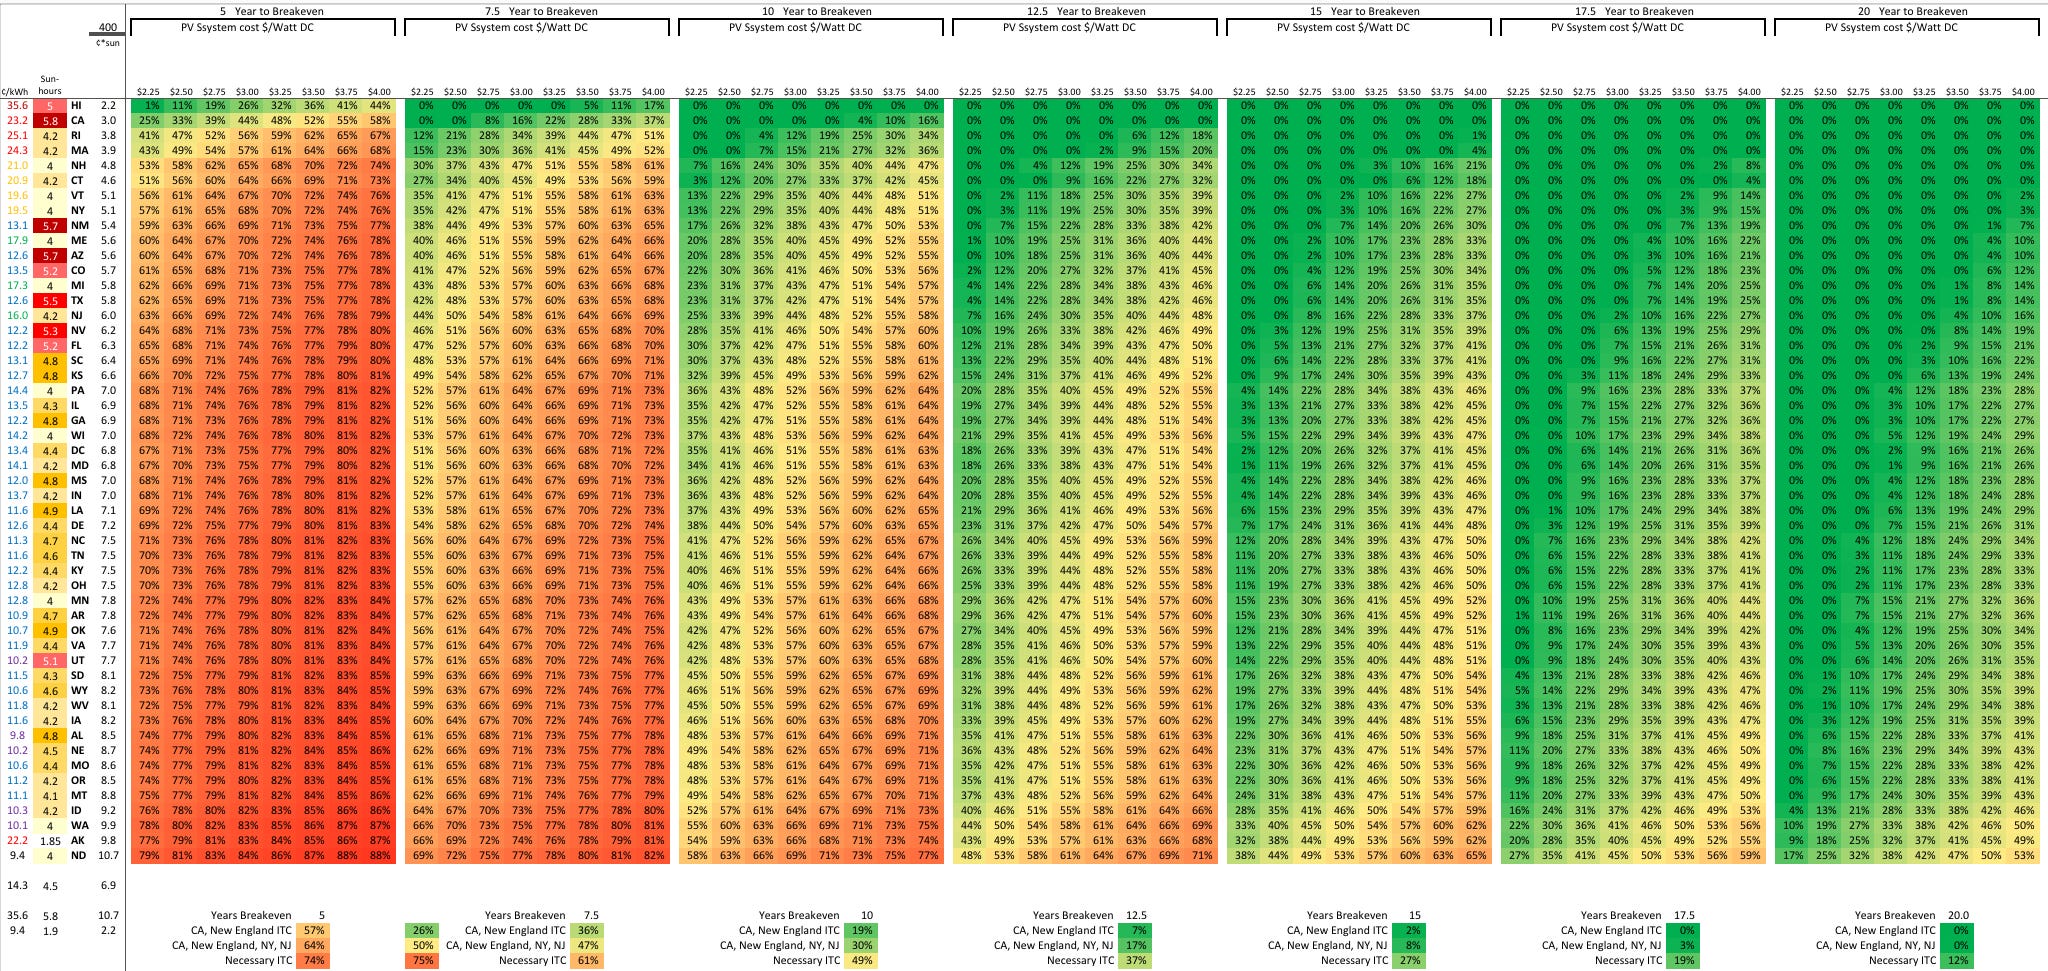
Clearly, with the U.S. Treasury paying for a quarter of the system, and if Covid hadn’t hit and the trend of the past decade had continued, then a great deal of America would find a rooftop PV system with a 25-year expected service life would pay for itself in less-than half that time in California, New England, Arizona, Colorado, Michigan,Texas, New Jersey and New Mexico.
Breakeven would even be as fast as a quarter of that time in Hawaii. And still 14 more states plus D.C. would breakeven in under 15 years. While not a bonanza of an investment in all remaining states except one, North Dakota, breakeven is achieved in under 20 years.
Yet even with the 26% ITC, residential rooftop PV rapidly looses a fast payback as the system cost increases. At a system cost of $3.50 per Watt, only the Northeast, California and Hawaii can expect to breakeven in less than half the expected service life of the PV system. Indeed at $3.50/Watt, most of the country would not breakeven until well into the mid-life to the twilight of the PV system.
At $4.00/Watt the payback is bleak across the country, where only Hawaii, California, Massachusetts, and Rhode Island have a mediocre payback under 15 years. 40% of the country could not even breakeven until after the 25-year service-life of the system, a very dangerous gamble.
Granted the above is calculated at the present value of each state‘s residential electric rate, without accounting for price inflation of those rates, nor the interest rate of borrowed capital. But as previously stated, this paper is not speculating what that inflation rate might be. It would take many static figures at various rates to illustrate the payback. Or an interactive graphic, with three sliders for the selection of the interest rate of borrowed capital, the electricity inflation rate, and the cost per Watt of the PV system.
— At the 2024 ITC of 10% —
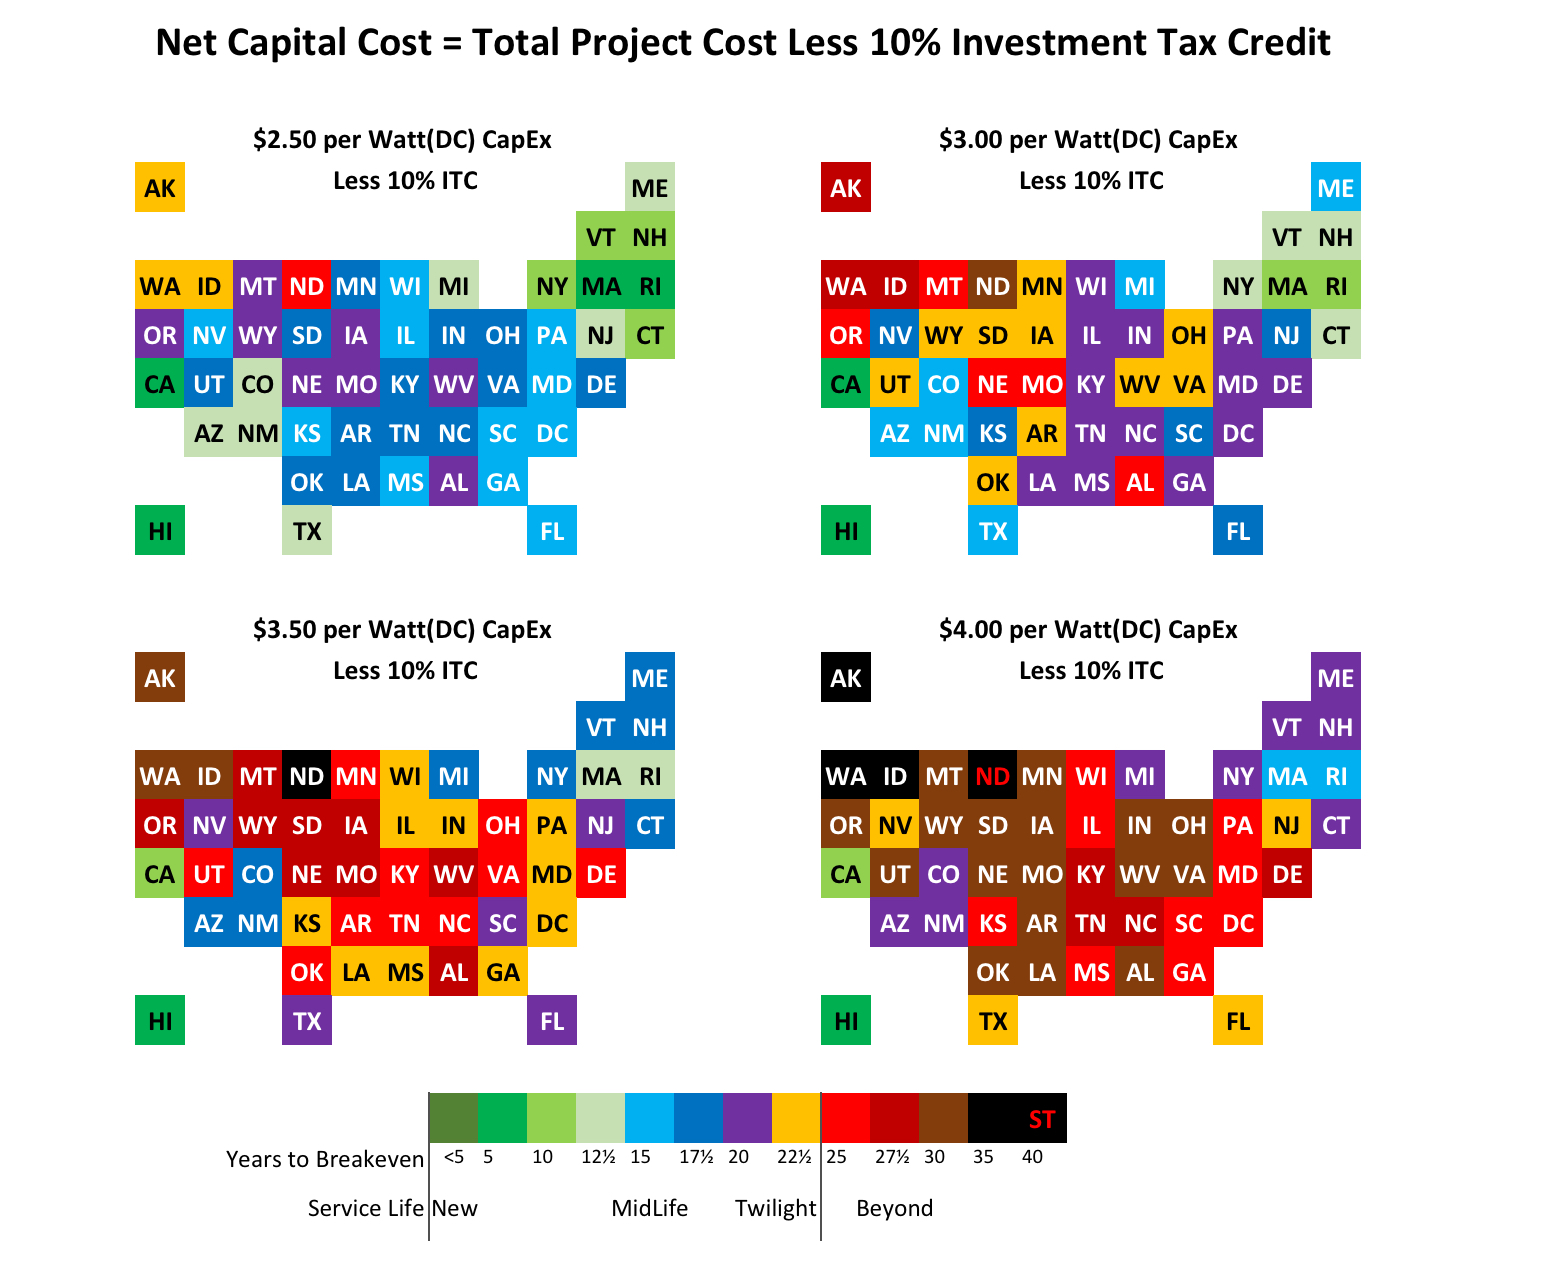
The one big variable not previously accounted for is the ITC, once it drops to 10% in 2024. And without surprise, it is a substantial negative effect, immoderately increasing the time to reach breakeven.
At the $4.00 per Watt installation cost, receiving only a 10% ITC makes for such a bad investment that, in 33 states and D.C., the breakeven is not achieved until after the estimated 25-year service life, 4 of which are so awful as to not breakeven until 35+ years, which is clearly impossible. Another 13 states don’t reach breakeven for between 20 and 25 years, which unless the project owner is betting on hefty energy cost inflation, makes for a poor investment. That leaves only Massachusetts and Rhode Island in 15 years, California with a mediocre 12 years to breakeven, and Hawaii 9.
In an optimistic scenario, with installation returning to NREL’s 2021 cost plus inflation, of $3.00 per Watt, only New England’s 5 small states and NY achieve breakeven in a middling 10 – 15 years, with only California and Hawaii being 5 – 10 years. 11 states reach breakeven in a mid-life 15 – 20 years, while 22 states & D.C. do not reach breakeven until 20 – 25 years, and another 9 states are worse than 25 years.
You get a subsidy. You get a subsidy. And you get a subsidy.
The conclusion is unmistakable. Residential rooftop solar photovoltaic systems are not profitable without generous government largess, or, the reliance on escalating inflation of electricity costs.
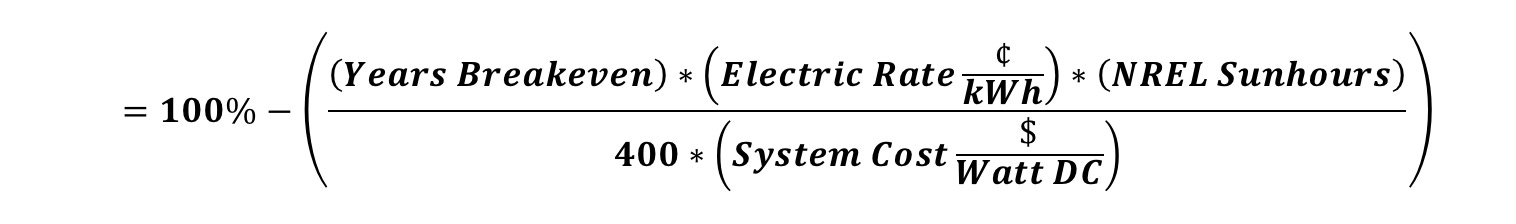
A simple approximation of the Years to Reach Breakeven, except for outlier states of Hawaii & California (lower result), and North Dakota & Alaska (higher result), is
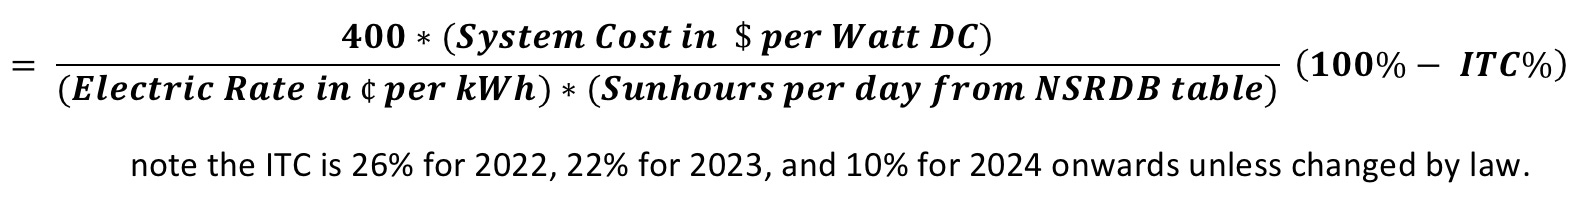
This is how any consumer from any state can evaluate any quote for an installed system, now or in future years, and determine if it is appropriate for them.
A Question of Policy
Working backwards, to determine the required ITC to reach a particular breakeven for a given State is
Therefore the question becomes, in what states with their inherent solar insolation and electric rates, does policy governing the ITC achieve a desired breakeven outcome, given the expected system costs?
Applying a range of system costs (from $2.50 to $4.00/Watt DC) and desired payback in years (5 to 25) to each state is, well, a daunting amount of data…
Fortunately, it can be greatly condensed.
Policy Takeaways
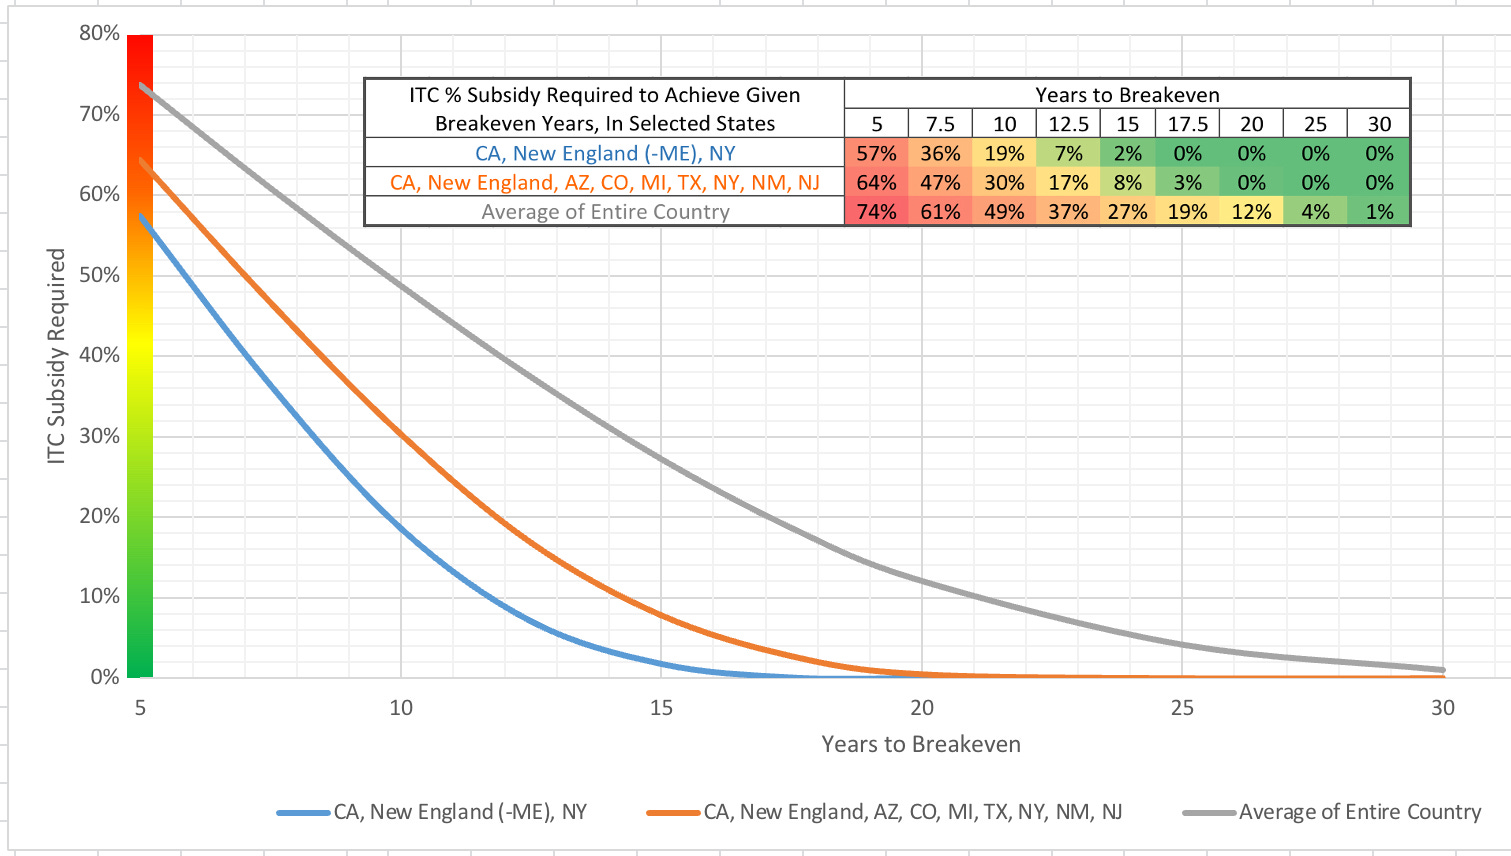
The above graph is not a recommendation for future policy, but a tool for those determining policy to evaluate outcomes.
It can be seen that the 26% ITC works well only for the states with the most expensive residential electric rates (Blue Line), yielding a decent breakeven in 9 years.
Adding in the Southwest, Texas, Michigan and New Jersey (Orange Line) and the period is extended by two years, what might seam a small amount of time. But going from breakeven in 9 years to 11 years is a 22% increase, an amount savvy investors might pass on.
In 2023 when the ITC drops to 22%, the breakeven timeframes from above only slightly increase, to 9-½ and 11-½ years respectively, not a significant change.
For the rest of the country (Grey Line), the 26% ITC stretches breakeven to 15-½ years. When combined with accepting all the risk for O&M, and a system having an expected service-life of 25 years, even the subsidy of 26% might not be attractive enough for most of the country. The 2023 drop to a 22% ITC stretches breakeven a year further to 16-½ years, starting to get unappealing for most of America.
If politicians and policy wonks were to determine, for instance, that a carrot juicy enough to be widely attractive would be to provide an ITC that yields a breakeven of 10 years for the majority of the country (Grey Line), then the ITC required is a whopping 50%. Such an ITC would let California, New England’s 5 small states, and New York (Blue Line) reach breakeven in a gift not to be passed-up of 6 years. The Southwest, Texas, Michigan and New Jersey (Orange Line) breakeven in 7 years.
A 40% ITC would give average states (Grey Line) a breakeven in 12 years which is comfortably ½ the service-life of the system. It would also let the most expensive states (Blue Line) breakeven in a quick 7 years, and the other better-breakeven states (Orange Line) in 8-½ years.
The simple reality is that in some states residential rooftop PV can be attractive, but in far more states it is at least highly, if not totally dependent upon the Investment Tax Credit government subsidy. Without Congressional action before 2024, the 10% ITC will send sales of residential PV into the basement.
A Resource — Typical Home PV System Sizes (Only for Grid-Connected Systems)
As noted, the size of the rooftop system does not affect the time it takes to reach breakeven, only the state and the cost per Watt. Nevertheless, as a resource to those considering adding a system to their home, here is a table of sizes of four typical systems for 4 different house sizes, along with the gross system cost before ITC, and the net cost after applying the ITC, now or in 2024.
This table is only to give homeowners an idea of the magnitude of size and cost of a typical system to power 4 different house sizes, with and without the load of having to charge an EV.
A typical home is furthermore heated with fossil-fuel, namely heating oil, natural gas, or propane. Switching to an electric heat-pump requires additional capacity.
For an EV, assume 1,000 miles driven monthly in an 80 MPGe vehicle (2.4 miles per kWh), requiring an additional 400-kWh of generation per month. Note this is the equivalent of a 25 MPG gasoline powered vehicle, consuming 40 gallons per month.
(This Table is only for grid-connected systems with utility companies receptive to net-metering, without battery storage, showing annual average generation. An off-grid System with Battery Energy Storage (BES) that is capable of meeting demand in January, with minimal daylight hours of production available, requires far, far, far more power capacity.)

Where:
$2.50/Watt is pre-Covid expected price based on consistently dropping PV prices.
$3.00/Watt is NREL 2021 residential PV pricing with post-Covid inflation.
$3.50/Watt is with additional demand surge to take advantage of the expiring ITC.
$4.00/Watt is with combined demand surge & inflation.