

Fiddling on the Rooftop
Fiddling on the Rooftop
Solar in Maine and Michigan can be as valuable as in Arizona and Texas. In the remaining New England states and NY, it is also more valuable than in Florida. If you can afford it.


The key word is valuable, which is simply multiplying solar insolation times the residential electric rate. Of course there is far more sunlight in the Southwest. But electricity is also far costlier in the Northeast.
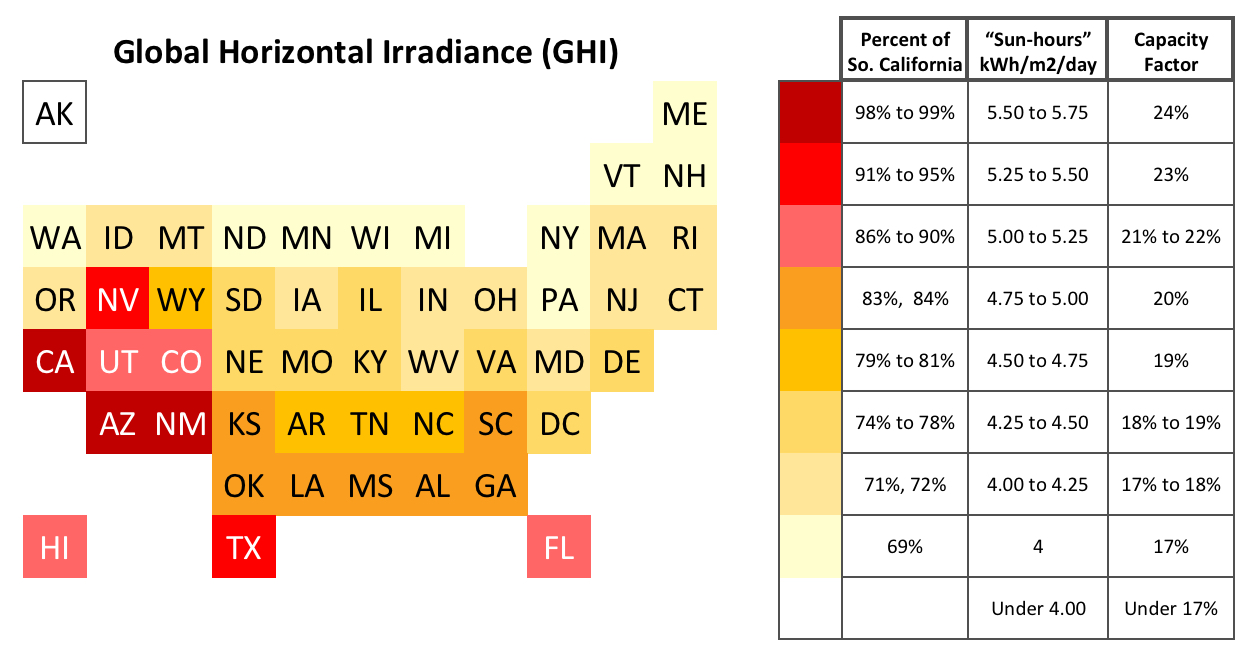
This is a map of the amount of sun availability, averaged annually, across U.S. states. The unit of the scale is Daily Insolation, measured in kilowatt-hours per square-meter per day (kWh/m2/day). Mathematically, it also works out to be identical to a vernacular unit, called “sun-hours”, or the average number of hours per day of visible direct sunlight. On the equator, one might think that is simply 12 hours. But there are clouds and rain, lowering the amount. Florida is a humid, wet state with frequent rain, unlike the dry deserts of Southern California, Arizona, and New Mexico, therefore the former has less sun-hours than the latter.
To make it easy to envision, a non-scientific scale, the percentage of Sunny Southern California Sunshine (or Southern Arizona and Southwest New Mexico) is included for the reader’s imagination. For the technically inclined, the Capacity Factor is a unit used in utility-scale applications, which is Daily Insolation divided by 24 hours.
Only 9 states have expensive, above-average residential electric rates. The highest and most outlandish is Hawaii at 36 ¢/kWh where everything is imported by ship, without the benefit of pipelines. That is double the national residential average rate. California, New York, Alaska, and the five smaller New England states are, respectively, from 25¢/kWh down to 20¢/kWh, or up to 50% above average.
Maine, New England‘s one big state, along with Michigan and New Jersey respectively pay 18, 17, and 16 ¢/kWh which is about average.
The 6 inexpensive states of Alabama, Idaho, Nebraska, Utah, and Washington State only pay 10¢/kWh, even a penny less for North Dakota, or almost half the national average.
The remaining 33 states and the District of Columbia, 65%, pay 12 to 14 ¢/kWh, still well below average.

The value to a residential photovoltaic system is the two numbers multiplied by each other. Baking in the sun with the most solar isn’t important if the electric rate is otherwise very low. Being on the Canadian border isn’t a dealbreaker either, despite obviously less generation than the sunny south, if the electric rate is high.
How do they compare?
Take for example a system on the larger side, for a 4 to 5-bedroom 3-bathroom house, which has 30 to 40 roof-mounted solar photovoltaic (PV) panels, rated 300 to 375 Watts (DC) each. It has a total capacity of 11,500 to 12,000 Watts (DC). Its output would be 7.5 kW (AC) of power, and based on the above solar insolation map, in a typical year will generate 11,000 to 15,000 kWh, averaging 1,100 kWh per month, depending on where in the country it is located.
For the average (medium sized) 3 bedroom 2 bathroom house, everything is nearly 80% of the above. Therefore 25 to 30 PV panels, 9,250 Watts (DC), output of 6.0 kW (AC). Annual generation would vary from 9,000 to 12,000 kWh, with average monthly generation of 900 kWh.
A small 2-bedroom 1-bathroom house is two-thirds the size, therefore a smaller system of 7,500 Watts (DC) from 20 to 25 panels. It generates 7,500 to 10,000 kWh annually (700 kWh monthly average) from 4.9 kilowatts (AC).
(Note, remember DC is typical of batteries and electronics, AC is typical of the wiring in homes, commercial and industrial buildings, and transmission & distribution lines. Also, technically, they are called PV modules, not vernacular panels.)
Multiplying the annual generation by the state average residential electric rate, and dividing by 12, yields the average monthly electric savings.
The calculations below are for a large house. Multiply by 80% for a medium house, 65% for a small house.
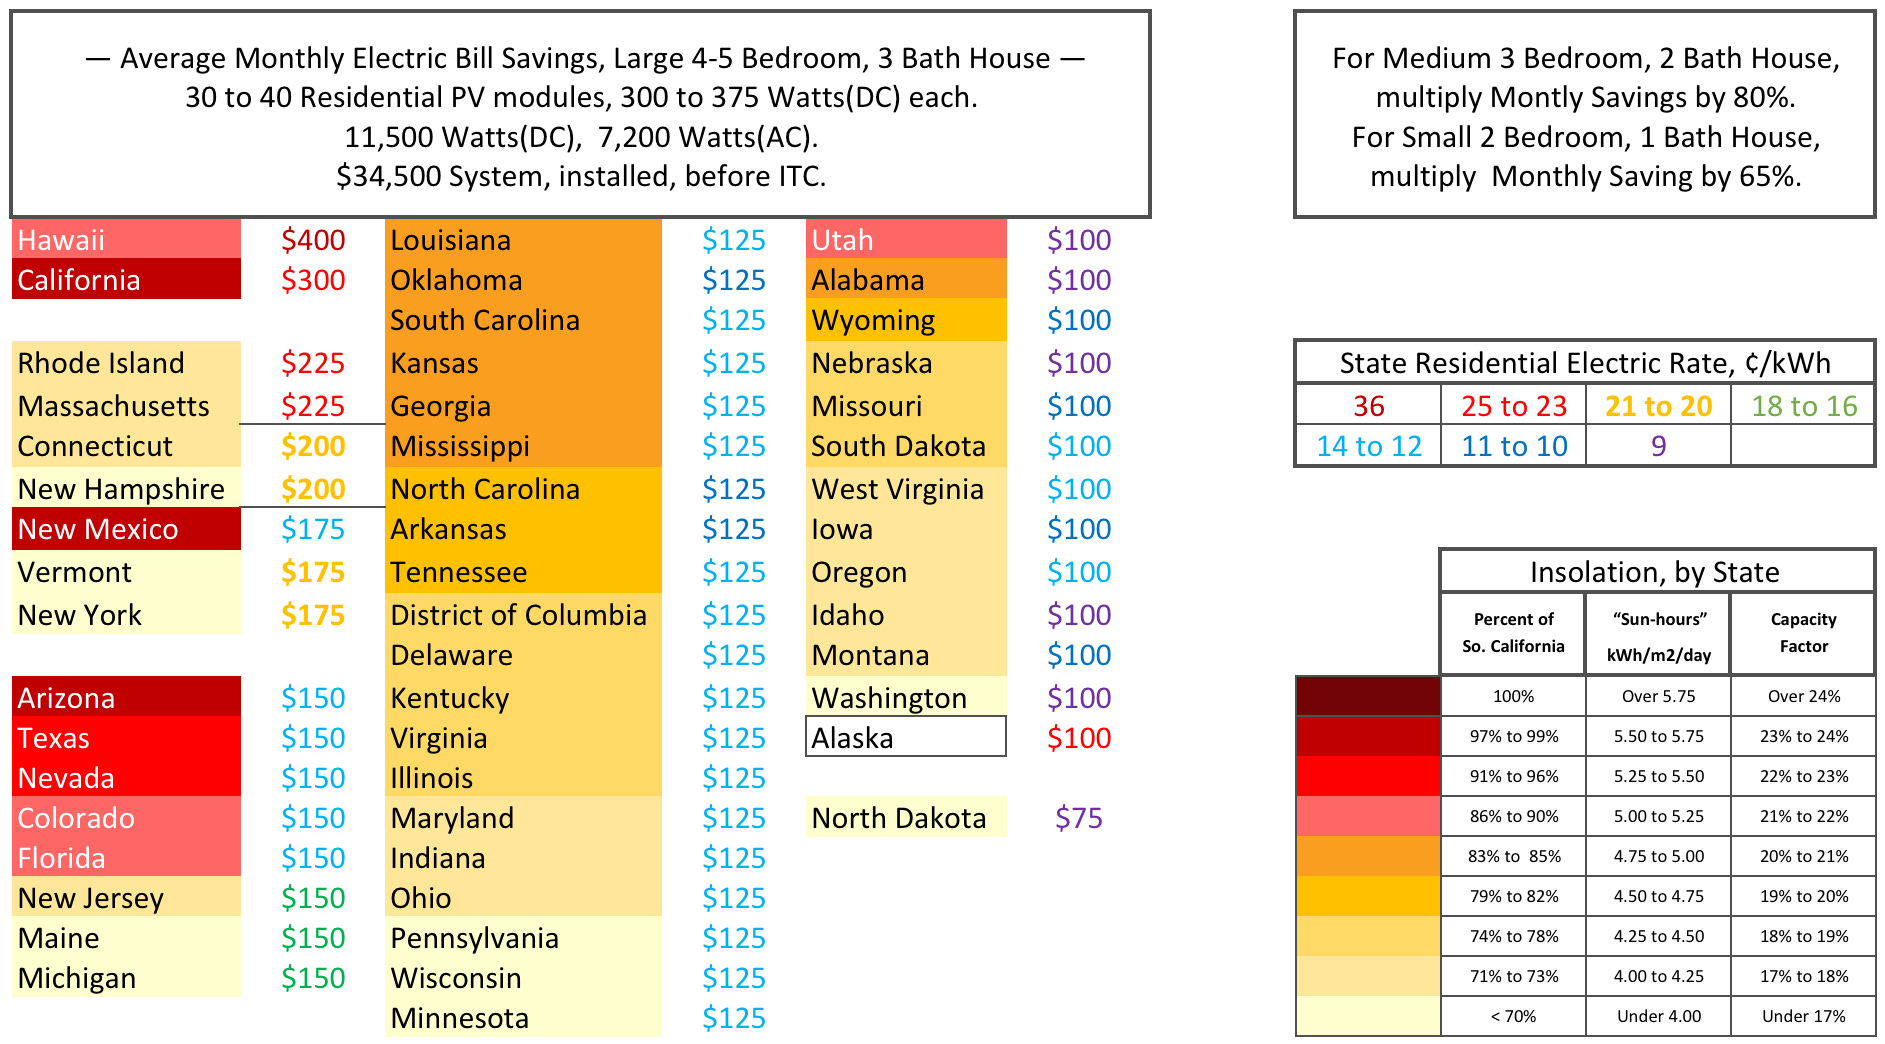
The cost, or Capital Expense (CapEx) of this system should be (more on that later) roughly $34,500 and for the remainder of 2022, unless Congress acts, there is an Investment Tax Credit (ITC) of 26%, which if unchanged drops to 22% in 2023, then 10% in 2024. That leaves a $25,500 net capital expense.
Is it worth it?
The sales pitch goes like this — The average savings in New England (except Maine), New Mexico, and New York, is more or less $200/month, or $2,500 per year. In 10 years then, it pays for itself, after subtracting $9,000 for the 26% ITC. After that you get 15 years of free electricity, assuming a 25 year trouble-free service life. In Hawaii it’s half the time, California two-thirds the time. Sounds good, right?
Warren Buffett would be doing an eye-roll now. He recently said the only reason for renewables is for the tax-credits. Using that statement as a guide, paints a very different picture. First, the entire $34,500 project is financed, at 3½ %, for 20 years, which is $200 per month. So you sign your name, and for two decades instead of paying the utility $200/month it goes to the bank. What is the point you ask?
That tax credit is the point. Sign your name, and get a check for $9,000 from the U.S. Treasury. Now the caveats is you have to be a high-earner to begin with to be paying over $9,000 in federal income-taxes in the first place. If you only have $4,500 income-taxes due, you loose ½ the Tax Credit. There is no carry-forward, (* unless a complicated tax investment strategy, MACRS depreciation, is adopted. Consult a CFP.)
Envision this is 1,000 times as big: a $35 million, 12 MW utility-scale system, with 35,000 modules covering 25-acres of land. Same idea. The tax credit is $9,000,000. Don’t forget the deduction on interest, depreciation and land-lease too. Now you see how the wealthy continue to make money.
Two more, albeit smaller, caveats
First, the sales pitch that looking at the net cost after ITC, yielding a 10 year payback, assumes the project the is being paid for in cash from savings. Borrowing the same net project cost after ITC even at a meager 3.5% interest rate, requires not a 10-year loan period, but a 13 year, 4 month loan period for the monthly payment to equal the savings. That is a relatively big timeframe difference, 13.33 vs 10 years to breakeven. It however can be assumed the annual price increase of electricity is equal to the interest rate, returning to yielding a 10 year breakeven.
Second, that 25-year project timeframe assumes it keeps working without failures. The inverters, they ‘convert’ the DC power to usable AC, are electronic devices. Most only have a 10 to 12 year warranty, some as low as 7 years. Enphase does make a new string-inverter with a 25-year warranty. But note some early adopters of rooftop PV had inverter failures and found the company no longer in business. The manufacturer and sales of PV modules, inverters, and Balance Of System (BOS) controllers is the new wild-west, with fierce competition for future dominance. Some will succeed. Others will fail.
Other factors to consider
Are you ready to assume responsibility for your electricity? Don’t forget about Operations and Maintenance (O&M) expenses. Many larger companies include O&M service contracts as part of the quotes. Inverters are not maintenance-free. The low-voltage wiring between modules is usually not run within conduit, as per National Electric Code (NEC) it isn’t required. Does that mean it is protected from squirrels or other rodents making nests, that enjoy chewing wires in their way?
Interest rates are increasing. The rising inflation rate vs the constant price-decline of the cost per Watt of PV panels is a tug-of-war that up until 2 years of Covid, was always won by the dramatic price per Watt decline on PV panels. Not anymore. The supply-chain crunch has alone clearly caused an increase in recent prices. The questionable lack of a Congressional consensus to extend the ITC has also caused a temporary increase in demand, to start construction before January 1st and maximize the existing ITC.
In January of 2021, the National Renewable Energy Laboratory (NREL) released report (# 78324) for the U.S. Solar Photovoltaic System and Energy Storage Cost Benchmark: Q1 2020. The cost of Residential PV at the time was calculated to be $2.71 per Watt (DC) ($2,710/kW.) Adding two years inflation and the cost is up to $3.00/Watt, but combining the supply-chain delays and shortages, with homeowners trying to get projects underway before December 31st to qualify for the 26% ITC, and system costs, just for the PV, are now $3.25 to $3.75 per Watt (DC), especially in major metropolitan suburbs.
All is not gloom and doom. There are other hugely beneficial factors to consider too.
Is your roof at its end of life and needing replacement? Including the cost of a new roof with the project is perfectly acceptable to the IRS. Therefore, suddenly 26% of a huge homeowner expense is paid for by the U.S. Treasury.
Do power outages frequently occur where you live? Were you considering a generator? Now you can add a battery, which could be almost as big as a small refrigerator, to supply power at night or in a storm. The bigger the battery, the more systems and appliances it can power in your house, and the longer it can keep going. And like the roof replacement, IF it is included in the original project, the U.S. Treasury pays 26% of the cost again. But not if it is added to the project at a much later date, so homeowners must decide upfront.
Besides the federal tax credit, there may also be state tax credits, especially in California, New York, and most of New England.
Fiddling away
Clearly the ITC, a massive government subsidy directly for the project owner, is a major factor in the rapid deployment of solar at this time. Utilities are adding more PV capacity in 2022 than almost every other source combined, according to the EIA. 41 of the lower-48 states are adding utility-scale PV. Six states not adding PV, Idaho, Wyoming, North Dakota, Nebraska, Kansas, and Oklahoma, unsurprisingly align with states having a low savings shown above for residential systems.
One state shockingly not adding utility-scale PV is New Hampshire, with some of the most expensive electric rates in the country. It's not the northern latitude: neighboring Maine and Vermont, as well as similarly insolated Madison, Wisconsin, and lower Minnesota are building big utility-scale PV systems. The Koshkonong Solar Center In Dane County, Wisconsin secured approval plans for a $649 million utility-scale PV Plant to be operational by 2025, on 6,384 acres, of which 2,349 acres, 3.67 square miles will be utilized. It will be covered with about 3 million PV panels, “enough to supply 80,000 homes” per the press release.
What will happen in 2023 when the ITC drops slightly to 22%, and in 2024 to 10% unless Congress acts is questionable.
Next week, this column will examine actual results, state-by-state in years until breakeven for the payback period of the CapEx. In following weeks it will also examine state-by-State, the CO2 emissions based on statewide generation sources.